MAE Results table
vyepez
2023-07-07
Number of samples: 100
Number of genes: 11703
Number of samples with significant MAE for alternative events: 100
Cascade plot
a cascade plot that shows a progression of added filters
- >10 counts: only variants supported by more than 10 counts - +MAE:
and shows mono allelic expression - +MAE for REF : the monoallelic
expression favors the reference allele - +MAE for ALT : the monoallelic
expression favors the alternative allele - rare: - if
add_AF is set to true in config file must meet minimum AF
set by the config value max_AF - must meet the inner-cohort
frequency maxVarFreqCohort cutoff
ggplot(melt_dt, aes(variable, value)) + geom_boxplot() +
  scale_y_log10(limits = c(1,NA)) + theme_bw(base_size = 14) +
  labs(y = 'Heterozygous SNVs per patient', x = '') +
    annotation_logticks(sides = "l")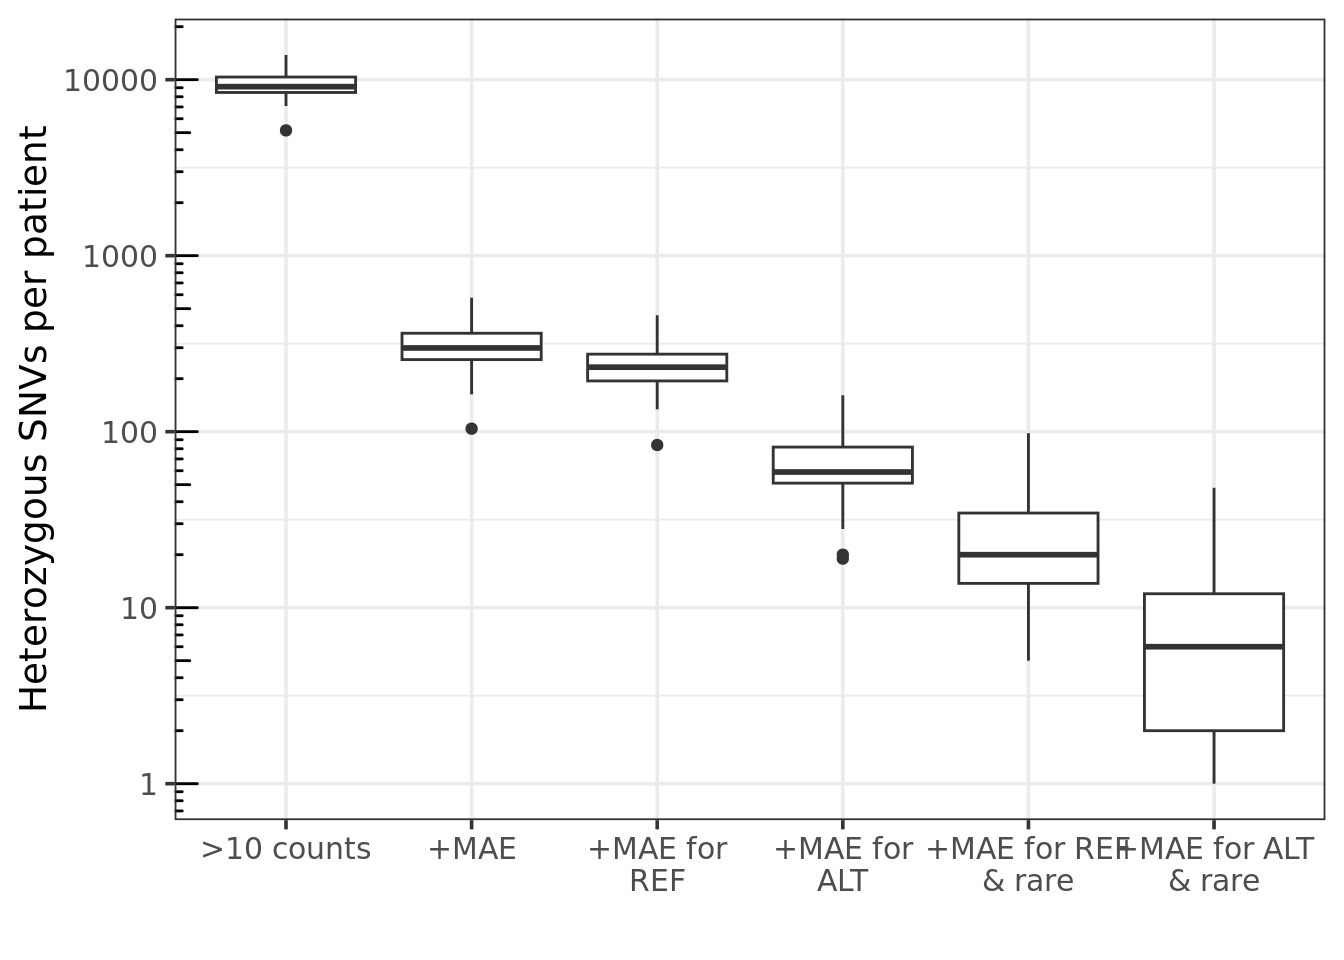
Variant Frequency within Cohort
ggplot(unique(res[,cohort_freq,by =.(gene_name, contig, position)]),aes(x = cohort_freq)) + geom_histogram( binwidth = 0.02)  +
  geom_vline(xintercept = maxCohortFreq, col = "red",linetype="dashed") + theme_bw(base_size = 14) +
  xlim(0,NA) + xlab("Variant frequency in cohort") + ylab("Variants")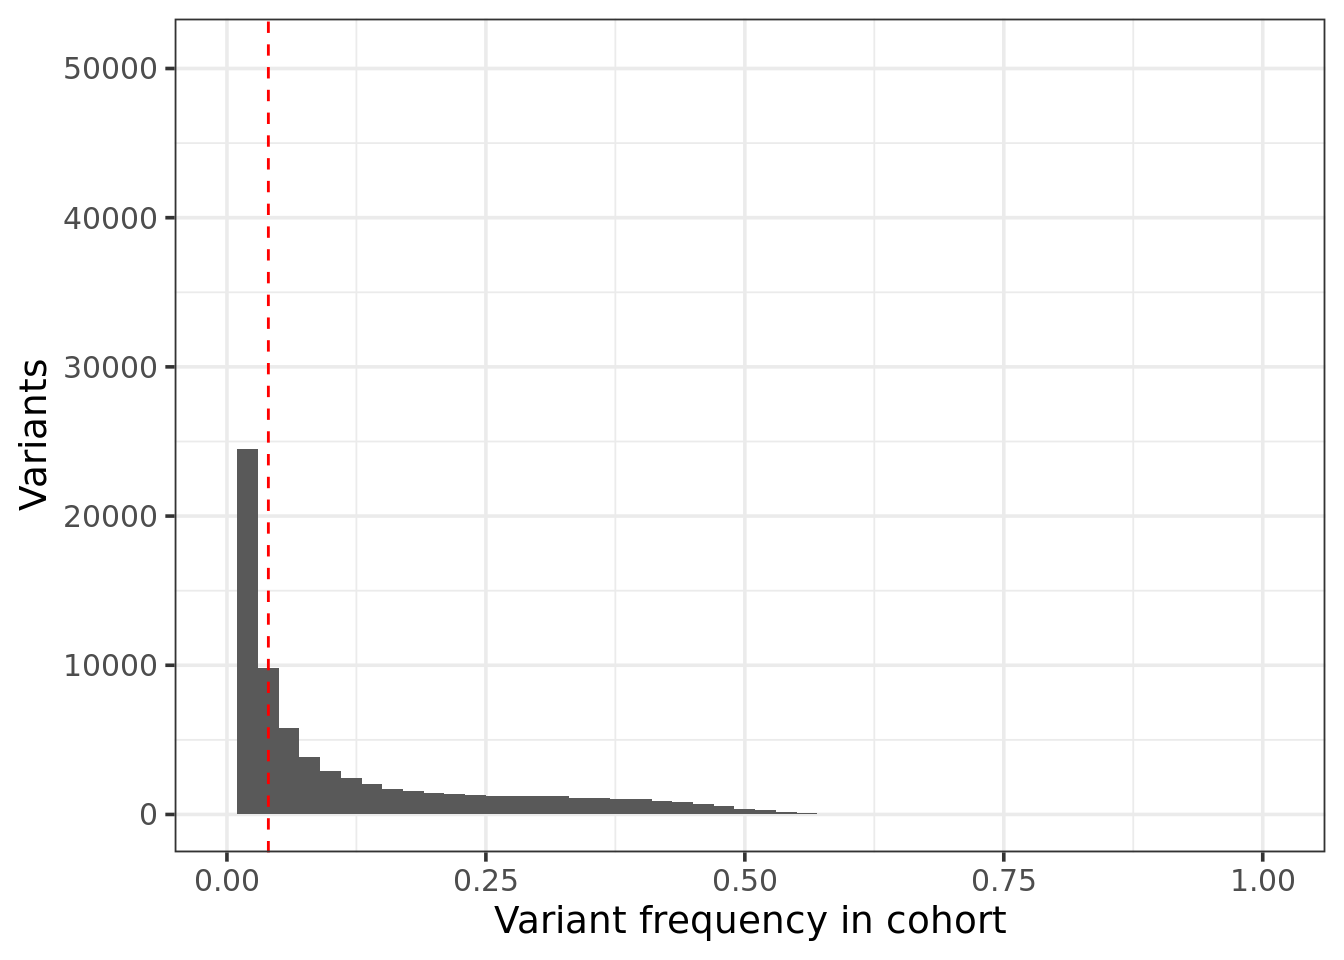
Median of each category
DT::datatable(melt_dt[, .(median = median(value, na.rm = T)), by = variable])# round numbers
if(nrow(res) > 0){
res[, pvalue := signif(pvalue, 3)]
res[, padj := signif(padj, 3)]
res[, log2FC := signif(log2FC, 3)]
}MAE Results table
DT::datatable(
  head(res[MAE_ALT == TRUE], 1000),
  caption = 'MAE results (up to 1,000 rows shown)',
  options=list(scrollX=TRUE),
  filter = 'top'
)