DNA-RNA matching matrix
vyepez
2023-07-07
Plots DNA - RNA matching matrix
DNA - RNA matching values distribution
qc_mat <- readRDS(snakemake@input$mat_qc)
melt_mat <- as.data.table(reshape2::melt(qc_mat))
colnames(melt_mat)[1:2] <- c('DNA_ID', 'RNA_ID')

ggplot(melt_mat, aes(value)) + geom_histogram(fill = 'cadetblue4', binwidth = 0.05, center = .025) +
  theme_bw(base_size = 14) +
  labs(x = 'Proportion of matching DNA-RNA variants', y = 'DNA-RNA combinations') +
  scale_y_log10() + annotation_logticks(sides = "l") +
  expand_limits(x=c(0,1)) +
  geom_vline(xintercept=identityCutoff, linetype='dashed', color = 'firebrick')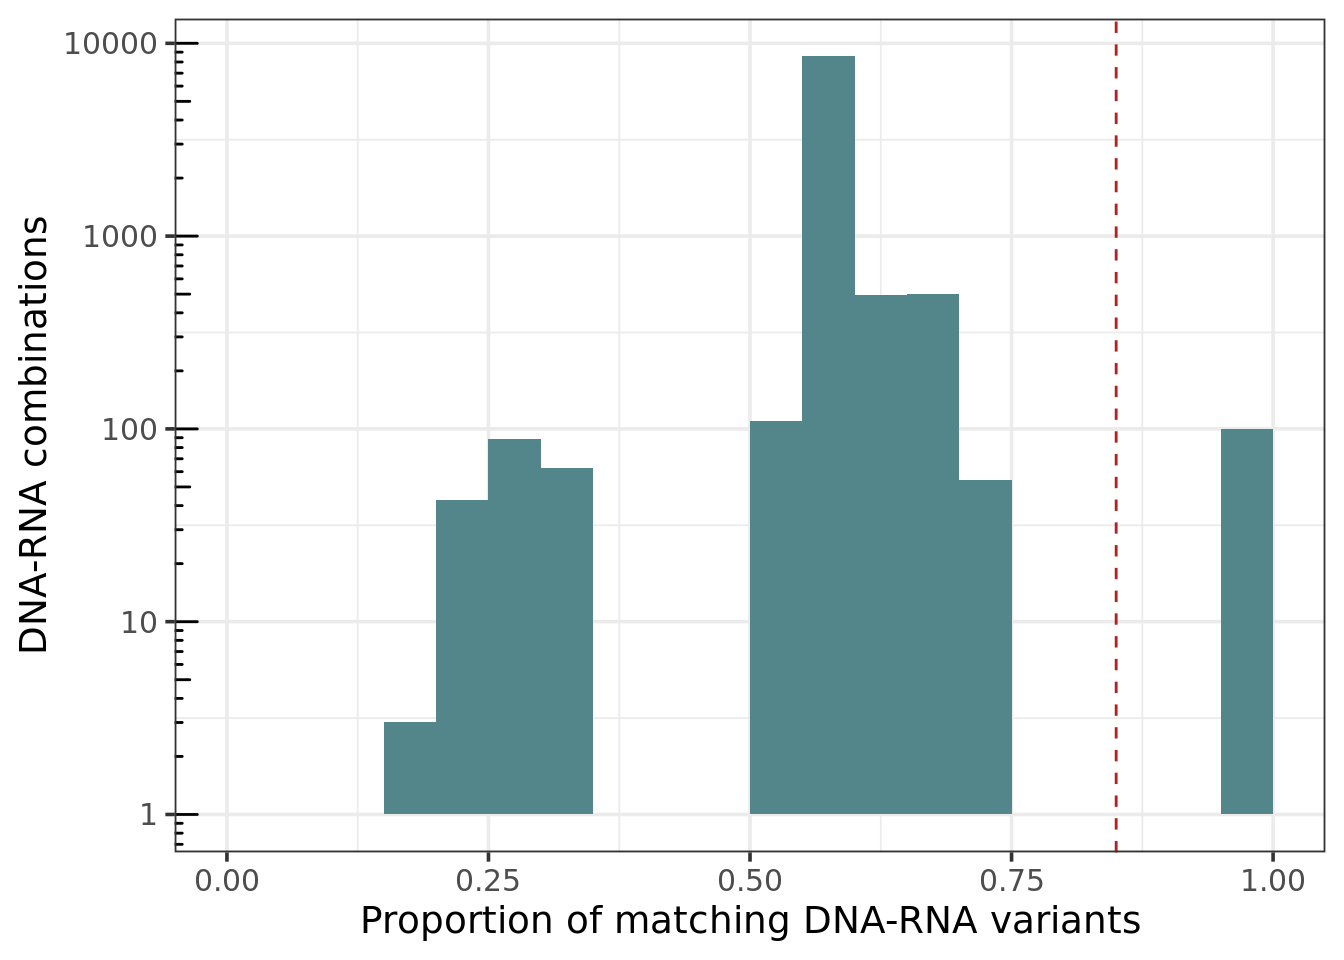
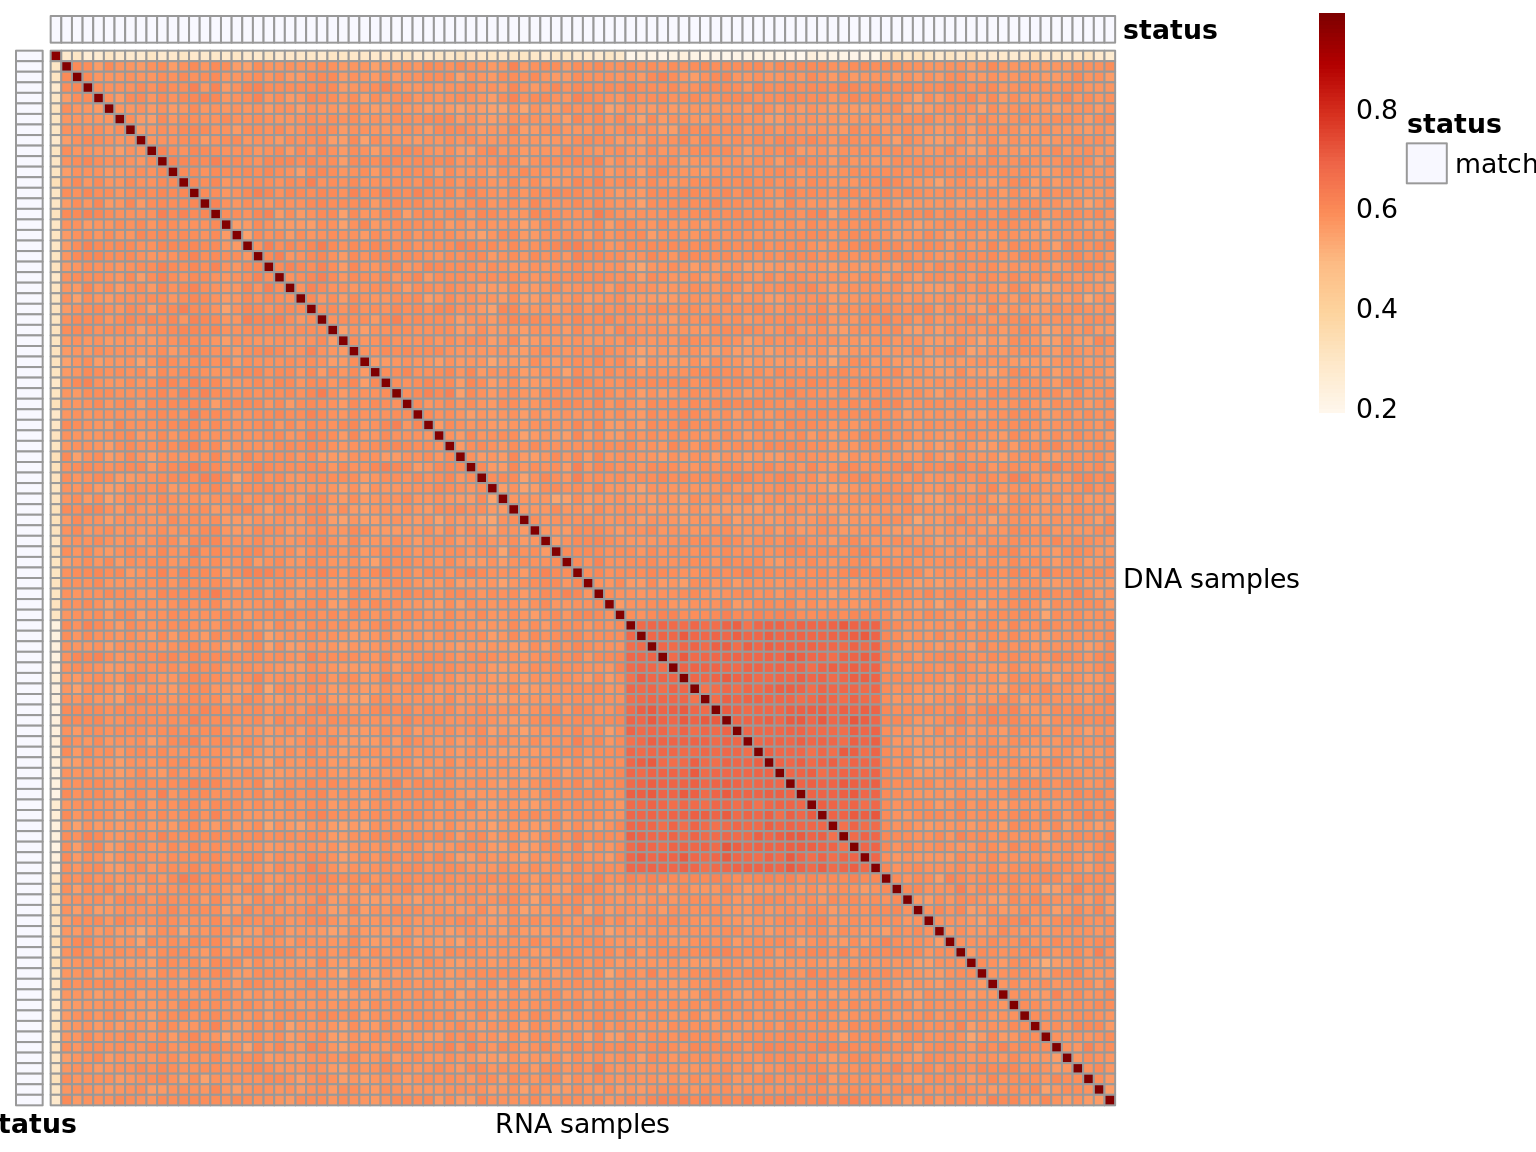
Heatmap of matching variants
Shows the proportion of matching DNA (rows) - RNA (cols) variants. Possible values are:
- match: the DNA sample matches the annotated RNA sample
- no match: the DNA sample does not match the annotated RNA and no match was found
- matches other: the DNA sample does not match the annotated RNA, but another match was found
- matches more: the DNA sample matches the annotated RNA, but also other RNAs not annotated to match
- matches less: the DNA sample is annotated with more than 1 RNA. Not all annotated RNAs are correct.
Similar for the RNAs.
qc_dt <- merge(sa, melt_mat, all = T)
qc_dt[is.na(ANNOTATED_MATCH), ANNOTATED_MATCH := F]
qc_dt[, PREDICTED_MATCH := value > identityCutoff]

# function to check the matches
check_matches <- function(annot_col, pred_col){
  if(sum(pred_col) == 0) return('no match')
  if(identical(annot_col,pred_col)) return('match')
  if(sum(annot_col)==1 & sum(pred_col)==1) return('matches other')
  if(sum(annot_col)>1 & sum(pred_col)==1)  return('matches less')
  if(sum(annot_col)==1 & sum(pred_col)>1)  return('matches more')
}

# check DNA and RNA matches (not necessarily the same)
dna_df <- data.frame(status = sapply(unique(qc_dt$DNA_ID), function(d){
  check_matches(qc_dt[DNA_ID == d, ANNOTATED_MATCH], qc_dt[DNA_ID == d, PREDICTED_MATCH])})
)
rownames(dna_df) <- unique(qc_dt$DNA_ID)

rna_df <- data.frame(status = sapply(unique(qc_dt$RNA_ID), function(r){
  check_matches(qc_dt[RNA_ID == r, ANNOTATED_MATCH], qc_dt[RNA_ID == r, PREDICTED_MATCH])})
)
rownames(rna_df) <- unique(qc_dt$RNA_ID)

# Colors for heatmap and annotations
color <- colorRampPalette(brewer.pal(n = 9, name = "OrRd"))(100)
ann_colors = list(
  status = c(match = "ghostwhite", `no match` = "firebrick", `matches other` = "darkorchid4",
             `matches more` = 'deepskyblue3', `matches less` = 'goldenrod2')
)
ann_colors[['status']] <- ann_colors[['status']][unique(c(dna_df$status, rna_df$status))]
if(nrow(qc_mat) > 1 || ncol(qc_mat) > 1){
pheatmap(qc_mat, color = color, cluster_rows = FALSE, cluster_cols = FALSE,
annotation_row = dna_df, annotation_col = rna_df, annotation_colors = ann_colors,
labels_row = 'DNA samples', labels_col = 'RNA samples', angle_col = 0)
} else {
print("No heatmap created as only 1 sample is provided.")
print(qc_mat)
}
Identify matching samples
Number of samples: 100
Number of samples that match RNA and DNA: 100
Median of proportion of matching variants in matching samples: 0.98
Median of proportion of matching variants in not matching samples: 0.58
Considerations: On our experience, the median of the proportion of matching variants in matching samples is around 0.95, and the median of the proportion of matching variants in not matching samples is around 0.58. Sometimes we do see some values between 0.7 - 0.85. That could mean that the DNA-RNA combination is not from the same person, but from a relative. It could also be due to a technical error. For those cases, check the following:
- RNA sequencing depth (low seq depth that can lead to variants not to be found in the RNA)
- Number of variants (too many variants called due to sequencing errors)
- Ratio of heterozygous/homozygous variants (usually too many called variants means too many heterozygous ones)
- Is the sample a relative of the other?
Samples that were annotated to match but do not
false_matches <- merge(sa, melt_mat, by = c('DNA_ID', 'RNA_ID'),
                       sort = FALSE, all.x = TRUE)
DT::datatable(false_matches[value < identityCutoff])
Samples that were not annotated to match but actually do
false_mismatches <- merge(melt_mat, sa, by = c('DNA_ID', 'RNA_ID'),
                          sort = FALSE, all.x = TRUE)
DT::datatable(false_mismatches[is.na(ANNOTATED_MATCH) & value > identityCutoff])