FRASER Summary: all–v29
mumichae, vyepez, ischeller
2023-07-07
saveRDS(snakemake, snakemake@log$snakemake)
source(snakemake@params$setup, echo=FALSE)

suppressPackageStartupMessages({
  library(cowplot)
  library(RColorBrewer)
})
dataset <- snakemake@wildcards$dataset
annotation <- snakemake@wildcards$annotation
padj_cutoff <- snakemake@config$aberrantSplicing$padjCutoff
deltaPsi_cutoff <- snakemake@config$aberrantSplicing$deltaPsiCutoff
fds <- loadFraserDataSet(file=snakemake@input$fdsin)
hasExternal <- length(levels(colData(fds)$isExternal) > 1)Number of samples: 100
Number of introns: 110839
Number of splice sites: 211180
# used for most plots
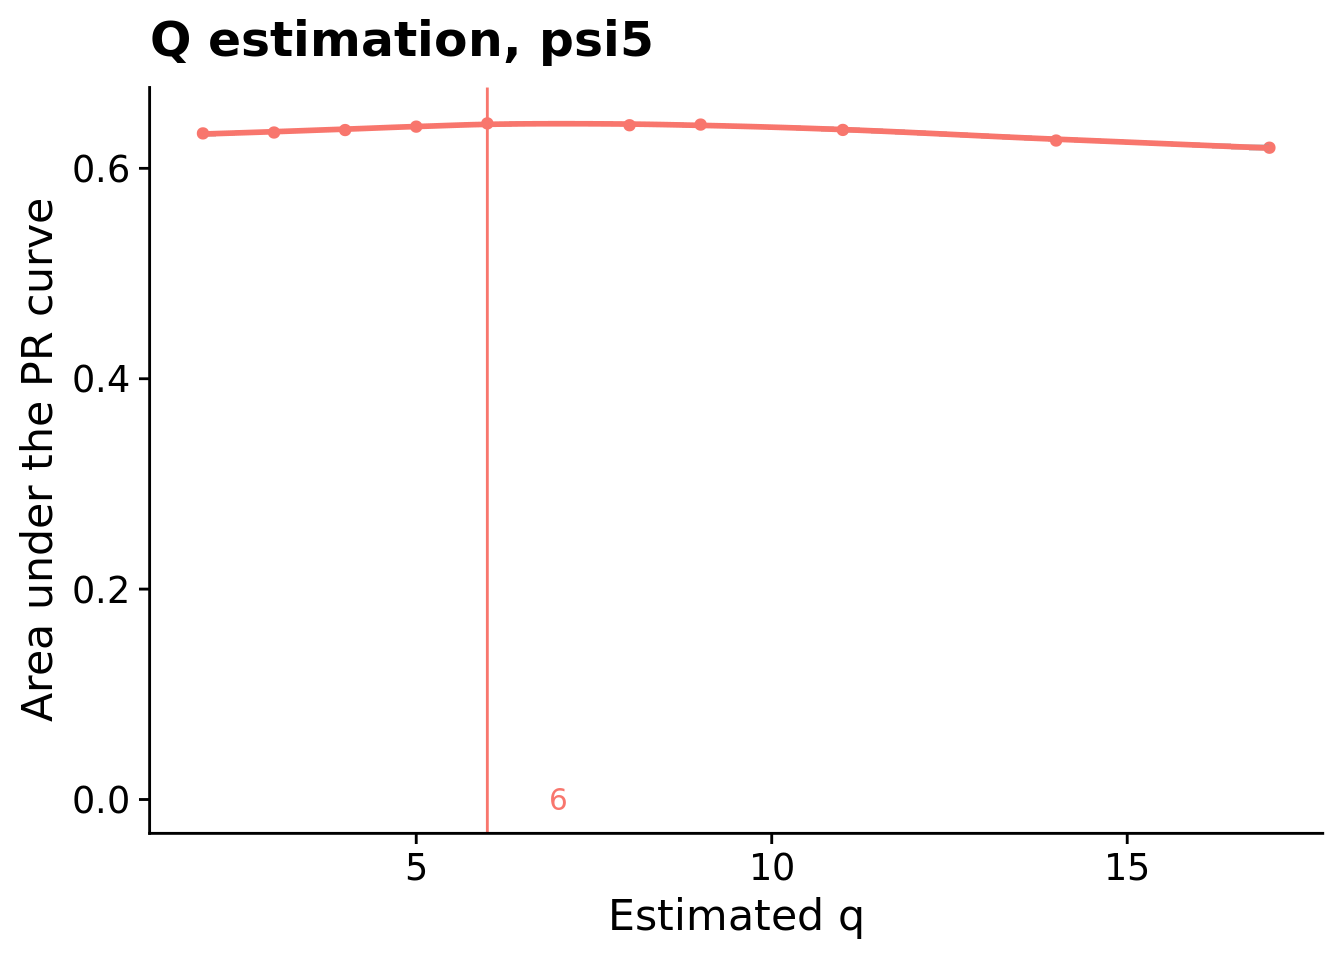
dataset_title <- paste0("Dataset: ", dataset, "--", annotation)Hyperparameter optimization
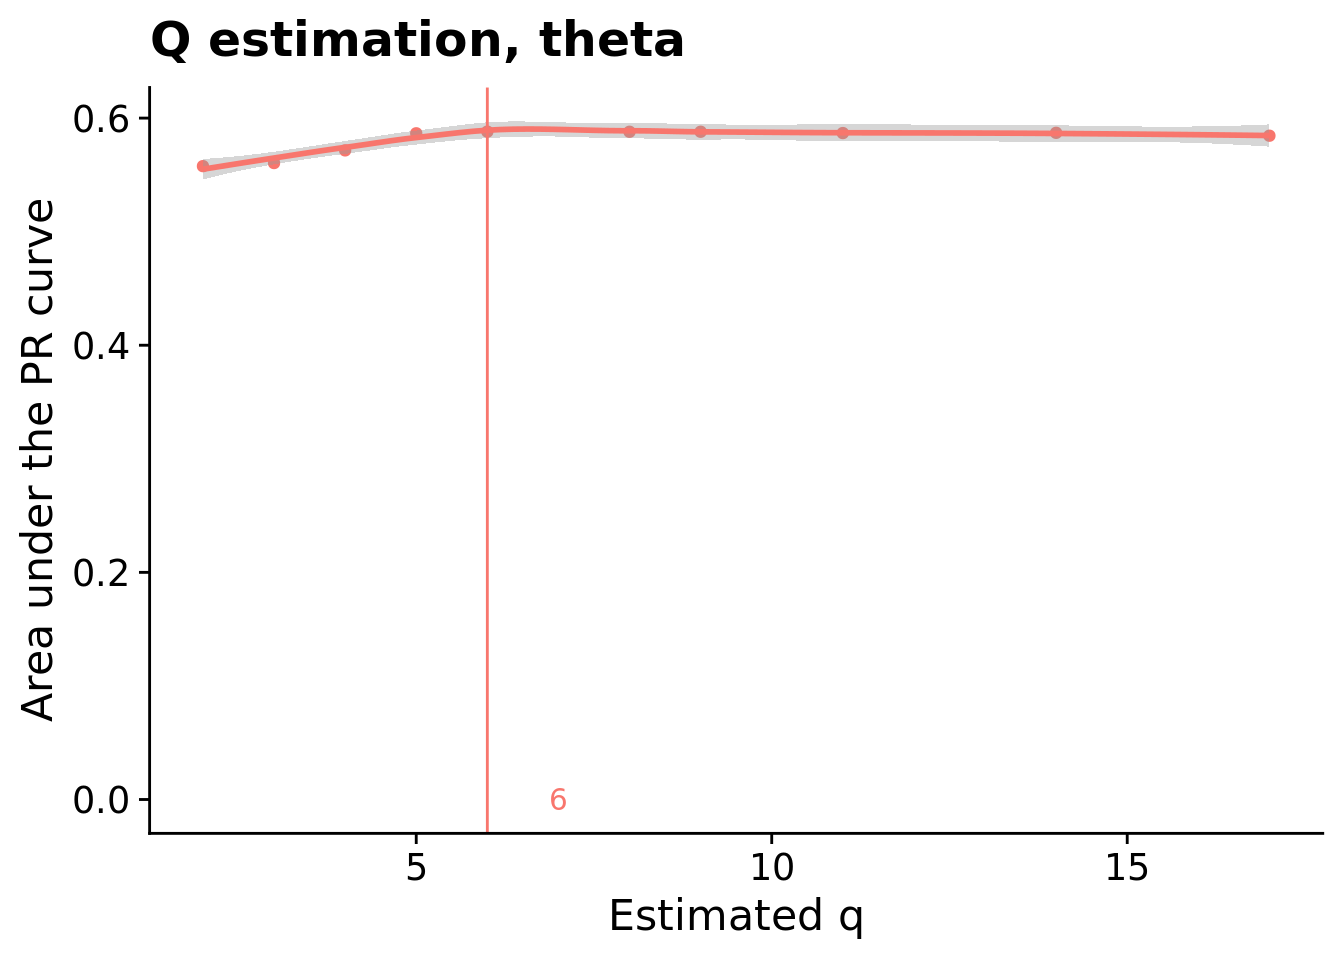
for(type in psiTypes){
  g <- plotEncDimSearch(fds, type=type)
  if (!is.null(g)) {
    g <- g + theme_cowplot(font_size = 16) +
      ggtitle(paste0("Q estimation, ", type)) + theme(legend.position = "none")
    print(g)
  }
}

Aberrantly spliced genes per sample
plotAberrantPerSample(fds, type=psiTypes,
                      padjCutoff = padj_cutoff, deltaPsiCutoff = deltaPsi_cutoff,
                      aggregate=TRUE, main=dataset_title) +
  theme_cowplot(font_size = 16) +
  theme(legend.position = "top")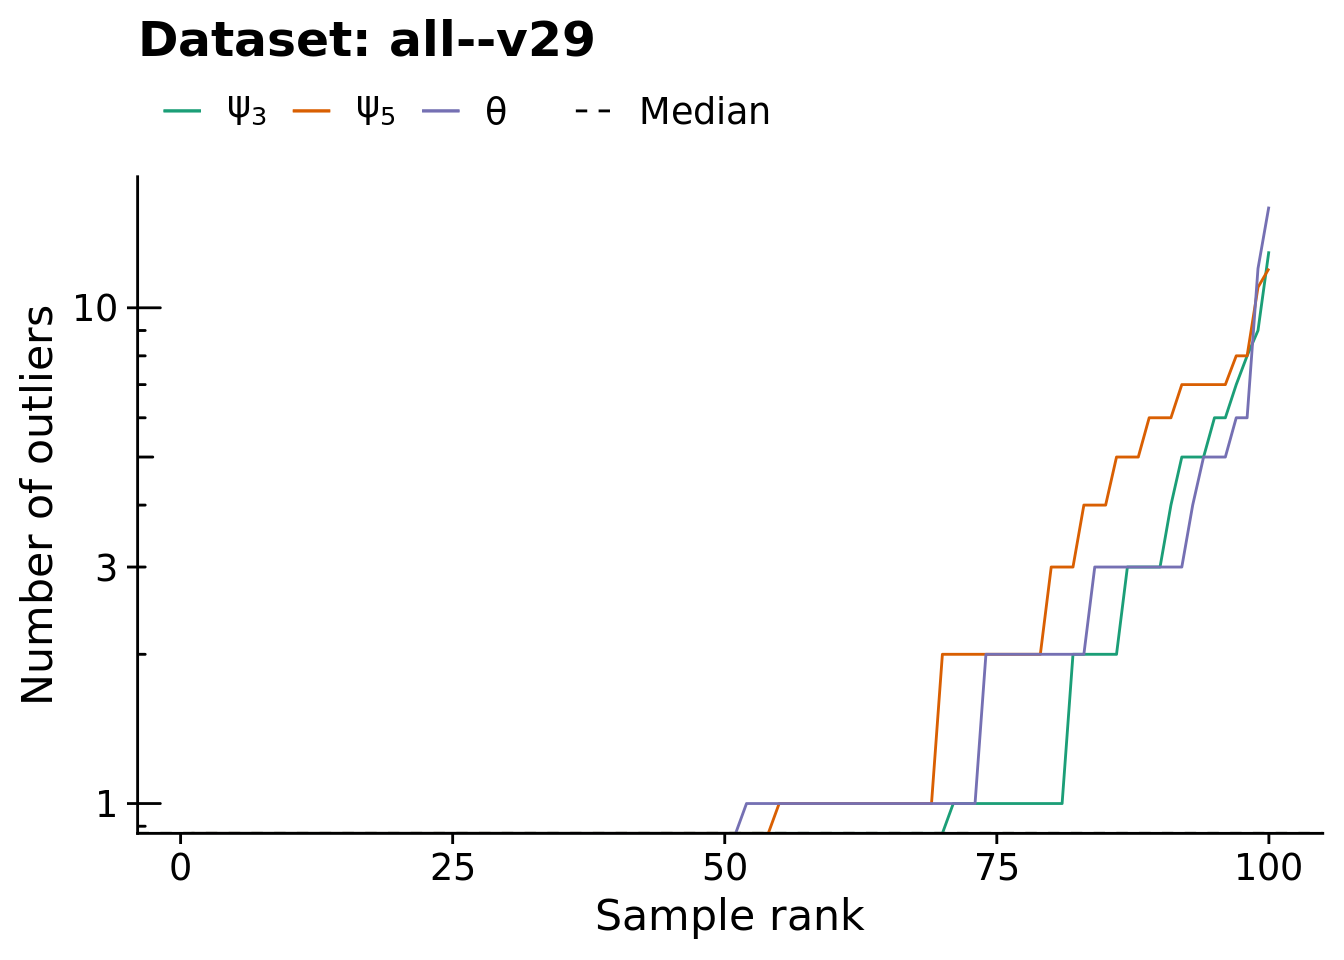
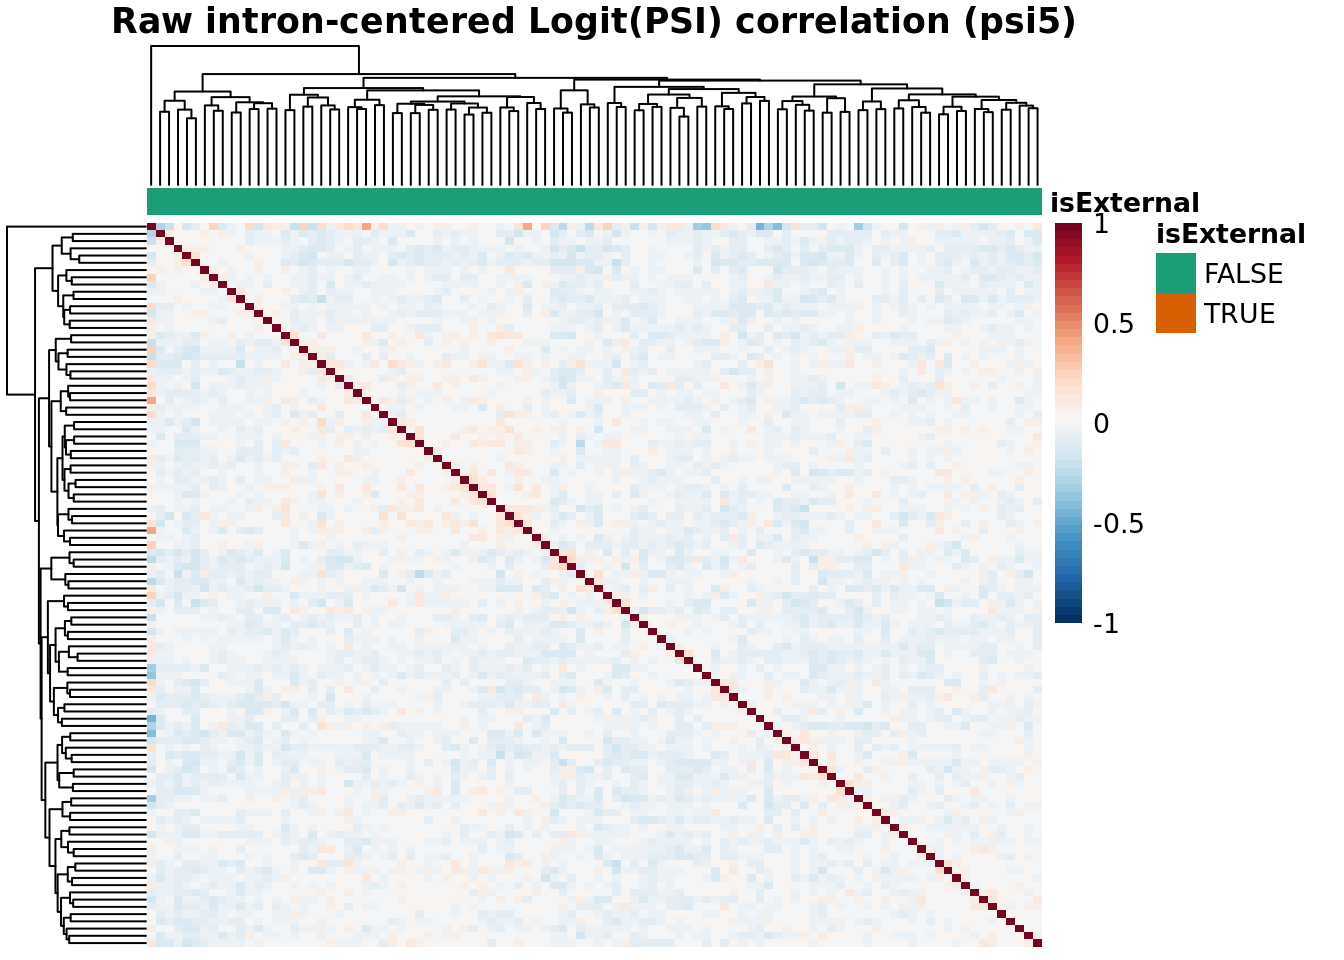
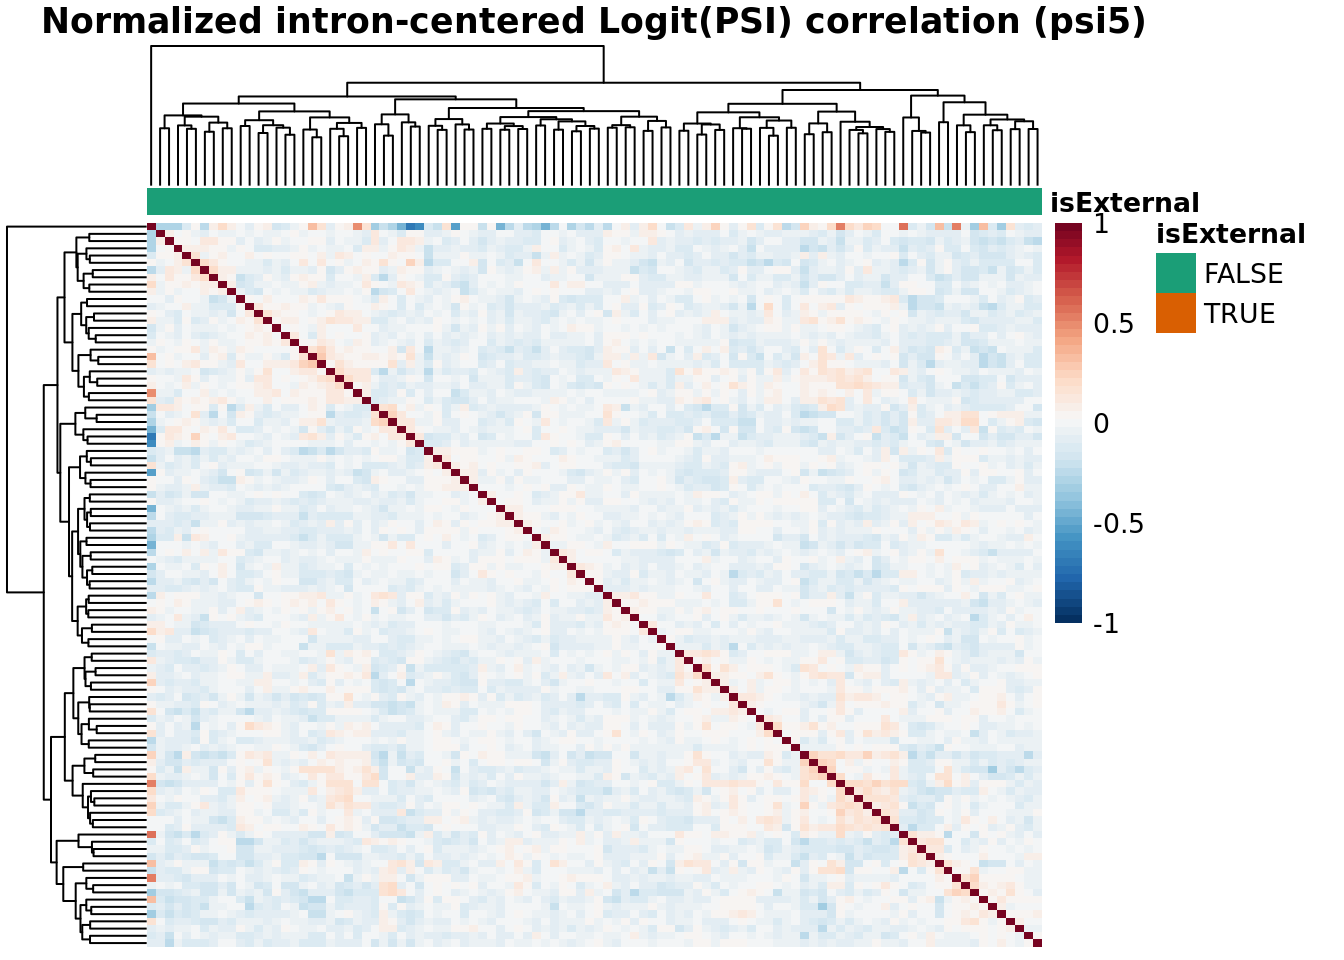
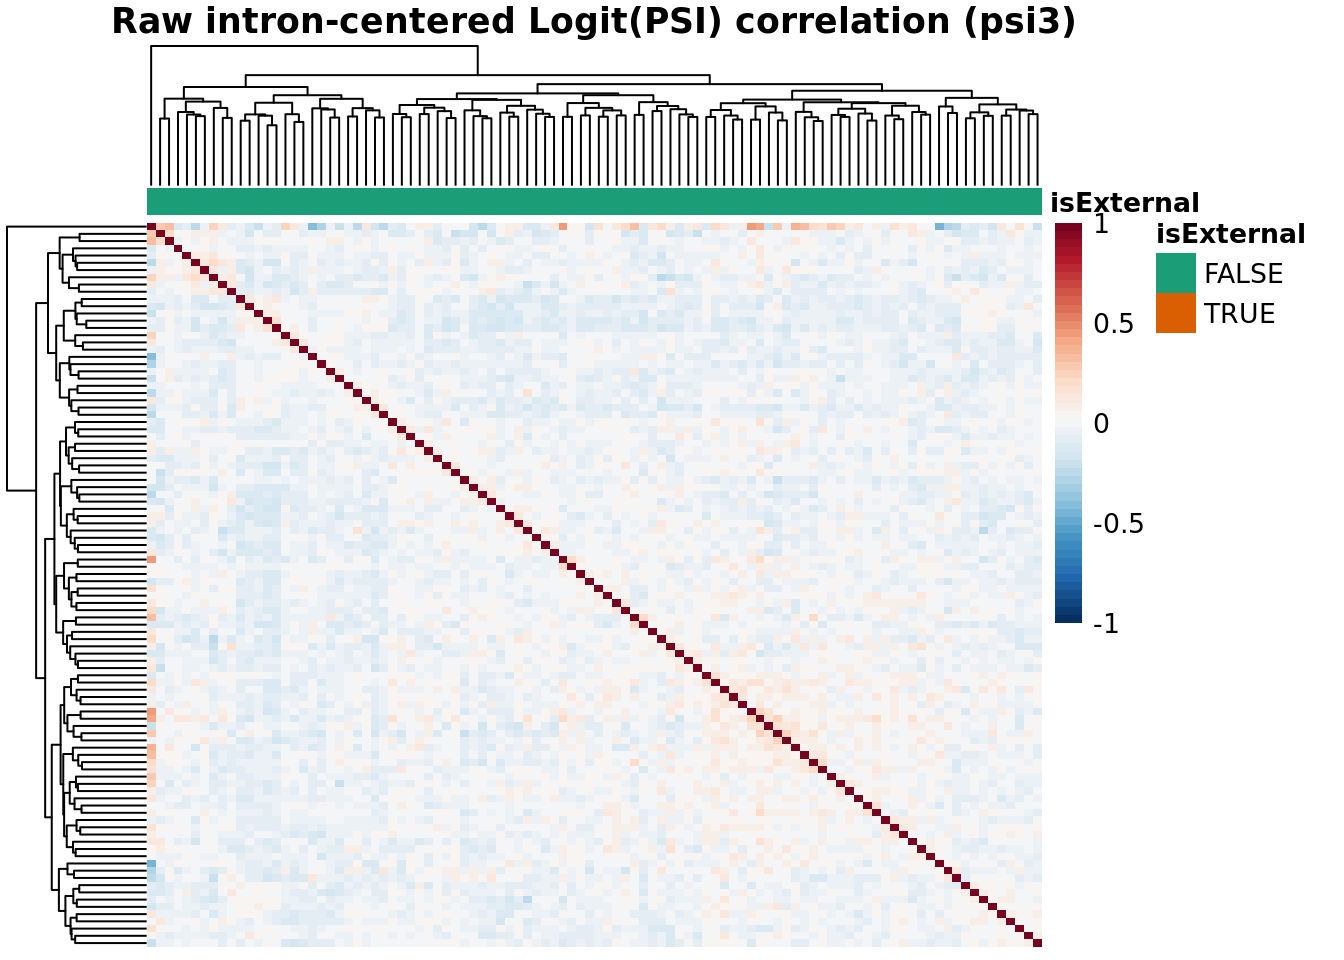
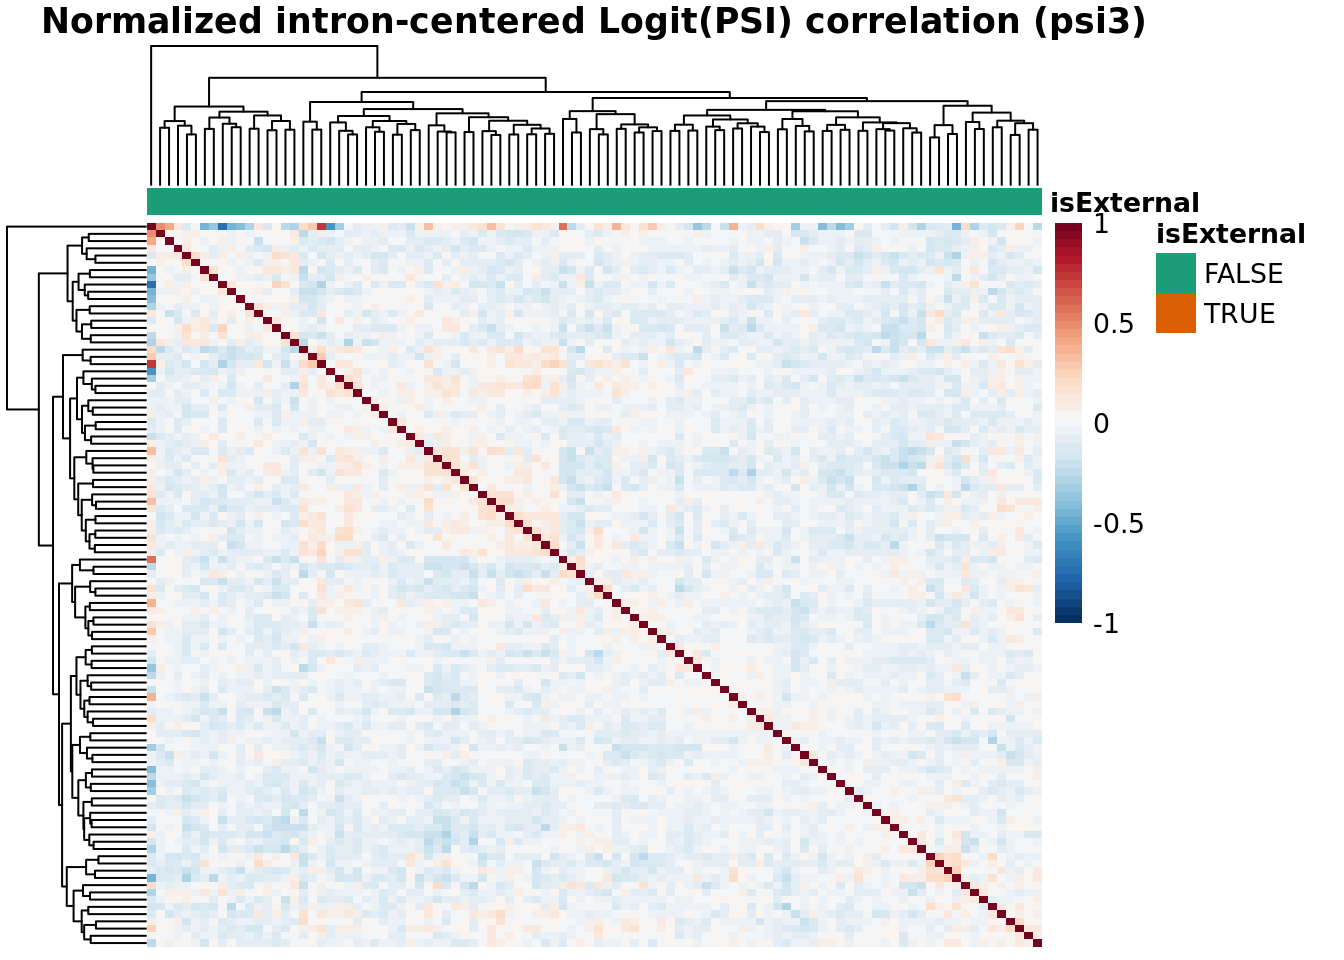
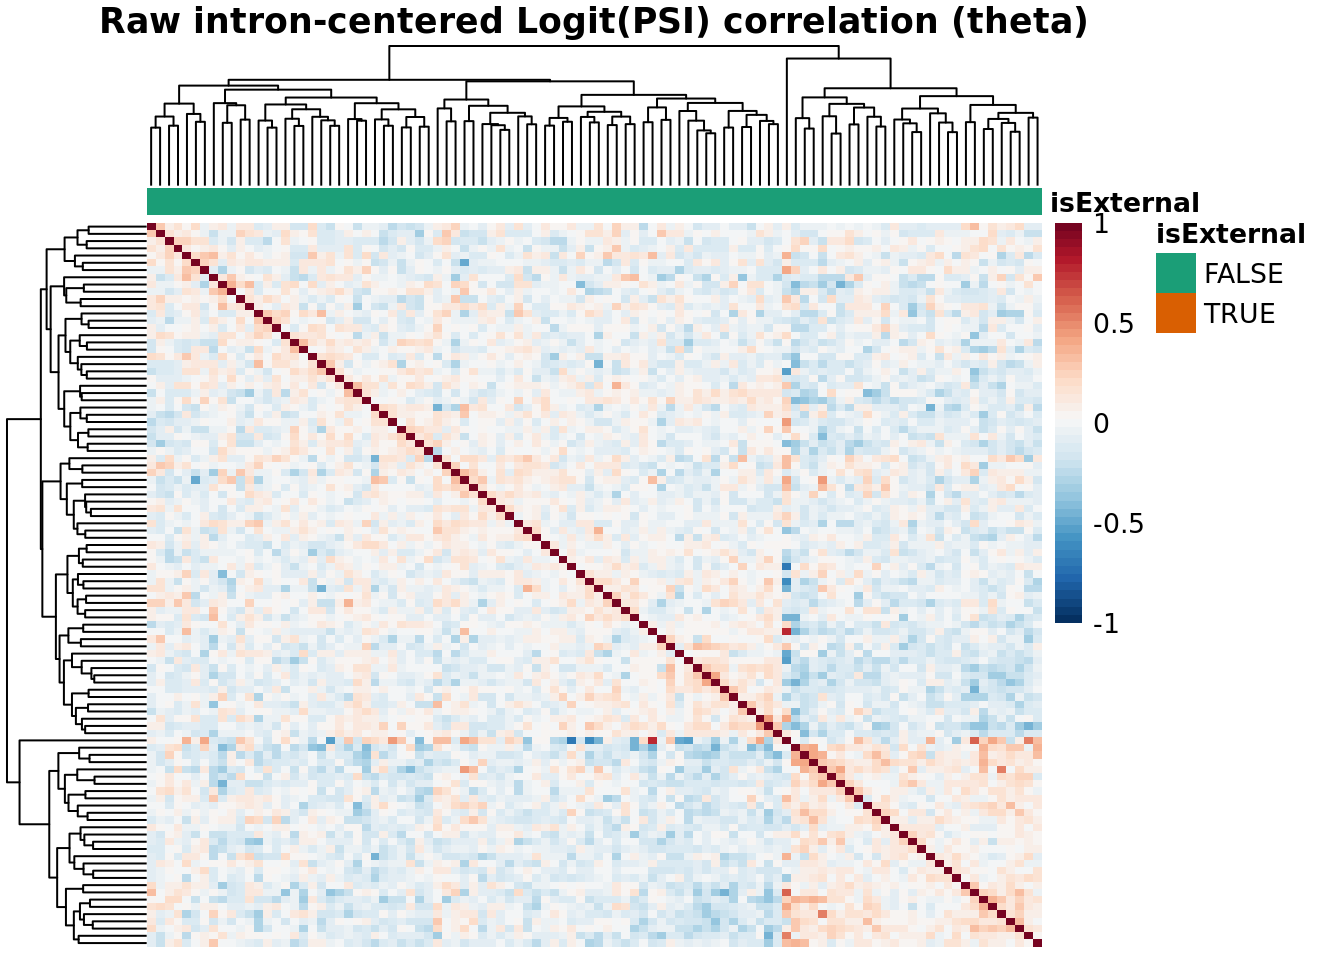
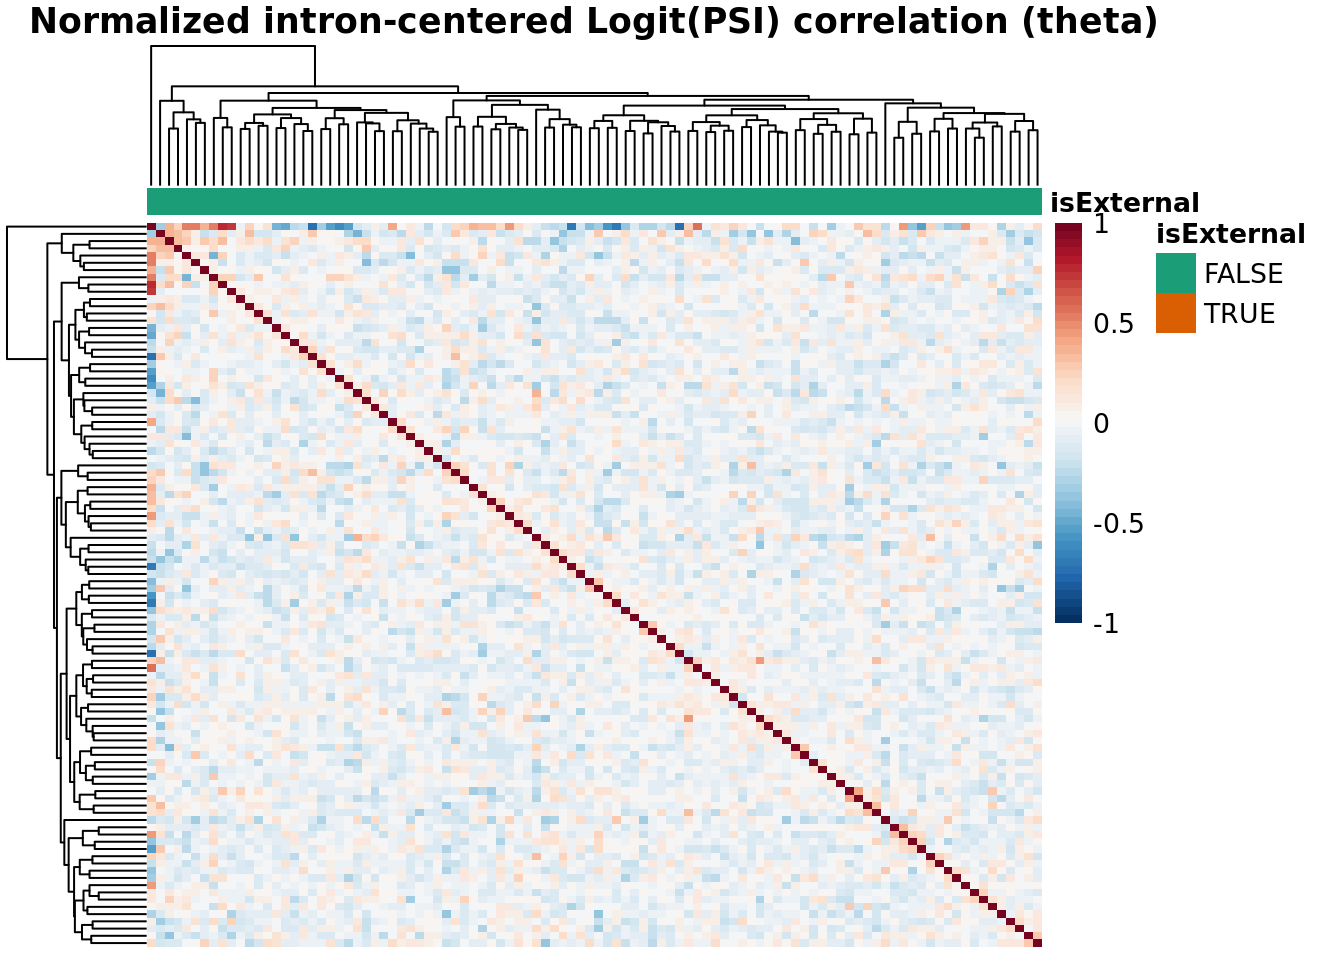
Batch Correlation: samples x samples
topN <- 30000
topJ <- 10000
anno_color_scheme <- brewer.pal(n = 3, name = 'Dark2')[1:2]

for(type in psiTypes){
  for(normalized in c(F,T)){
    hm <- plotCountCorHeatmap(
      object=fds,
      type = type,
      logit = TRUE,
      topN = topN,
      topJ = topJ,
      plotType = "sampleCorrelation",
      normalized = normalized,
      annotation_col = "isExternal",
      annotation_row = NA,
      sampleCluster = NA,
      minDeltaPsi = minDeltaPsi,
      plotMeanPsi = FALSE,
      plotCov = FALSE,
      annotation_legend = TRUE,
      annotation_colors = list(isExternal = c("FALSE" = anno_color_scheme[1], "TRUE" = anno_color_scheme[2]))
    )
    hm
  }
}
Results
res <- fread(snakemake@input$results)Total gene-level splicing outliers: 278
file <- snakemake@output$res_html
write_tsv(res, file = file)